Hunting for Kernel Module Memory Leaks.
My approach to find kernel module memory leaks inside my code.
Recently I was working on a dynamic malware analysis system. My job was to maintain and extend the VM part of a malware sandbox. In this VM we recorded malware samples and extracted important memory ranges as well as system calls with its arguments.
The VM part of the malware sandbox consists of a linux kernel module. Lately we were recording a slightly larger amount of malware samples and noticed crashes during the recording always after about 400 samples. As the crash occured always with different samples on a different code line, there was only one plausible explanation for it. There must be a memory leak somewhere..
When I started working on this project I was totaly new to linux kernel module development and had no idea how to debug anything. The last few months went quite well with just printing out statements on different lines in the code. However this does not really work with memory leaks and therefore I needed another approach.
My solution to this problem may not be perfect, but I worked quite well for my case and I therefore thought I could write a small statement about how to hunt for kernel module memory leaks.
Here we have the source code of a very small sample of a linux kernel module. This code contains a memory leak which for most people will be obvious. But to show how my approach works this is just fine.
1
2
3
4
5
6
7
8
9
10
11
12
13
14
15
16
17
18
19
20
    /*
     * author: storch
     * date: 24.01.2018
     */
    #include <linux/module.h>	/* Needed by all modules */
    #include <linux/kernel.h>	/* Needed for KERN_INFO */
    #include <linux/slab.h> /* Needed for memory allocations */

    int init_module(void)
    {
      char * output_string = kmalloc(sizeof(char) * 11, GFP_KERNEL);
      strncpy(output_string, "Hello world", 11);
      printk(KERN_INFO "%s\n", output_string);
      return 0;
    }

    void cleanup_module(void)
    {
      printk(KERN_INFO "Goodbye world 1.\n");
    }
To detect kernel memory leaks I used the Kernel Memory Leak Detector.
CONFIG_DEBUG_KMEMLEAK in “Kernel hacking” has to be enabled. A kernel thread scans the memory every 10 minutes (by default) and prints the number of new unreferenced objects found. – www.kernel.org
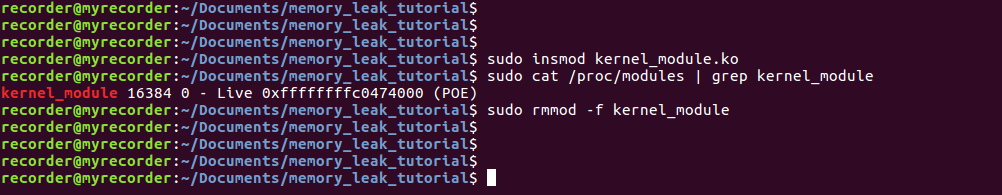
As soon as we inserted our kernel module we can check for the address where it has been loaded and its size. This address and size are interesting to us because we later want to find out if a certain memory leak comes from our kernel module or from somewhere else. After checking for the address we can remove our kernel module as the code was already executed inside the init_module function.
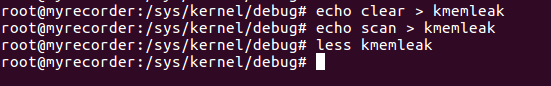
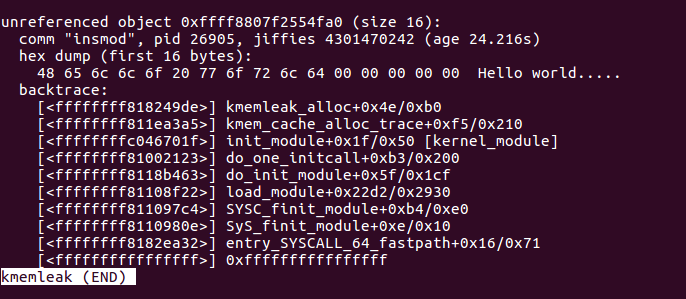
With the above given commands we can clear and scan for memory leaks with the Kernel Memory Leak Detector. I always cleared the kmemleak file before the execution of my kernel module and scanned afterwards for leaks. If we now open the kmemleak file we should find the following information:
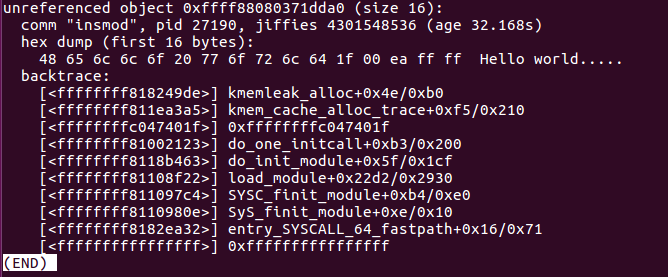
As can be seen there is a memory leak at the address 0xffffffffc047401f. Based on the buffer content we can assume that this is the leak from our kernel module. Normally this wouldn’t be that clear and therefore I calculate the difference between the given leak address and the address where my kernel module was loaded. If the absolute difference is smaller than the size of my kernel module then the leak must be inside it.
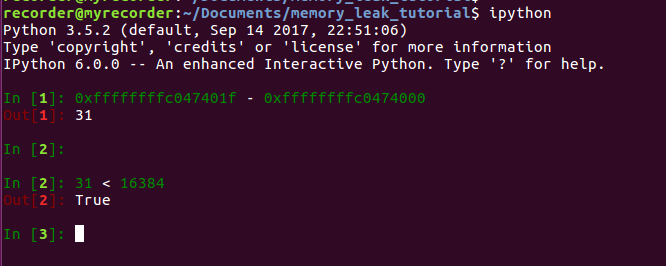
Based on the calculation above we see that the leak must be inside the kernel module. If the kernel module would still be loaded it would be much simpler as we would have the benefits of the symbol information. In this case the contents of the kmemleak file would look as follows:
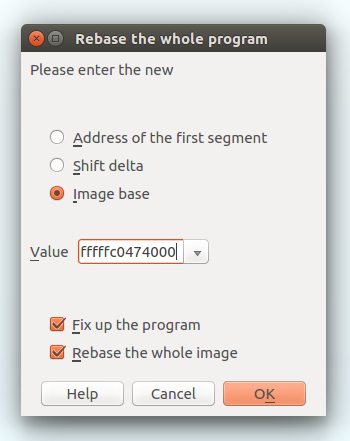
At this point I wanted to find out the exact line where the memory allocation was made which was never freed and therefore produced a memory leak. To do so I opened the kernel module with IDA Pro and rebased the kernel module to the address where is was loaded.
My next step was to take the leak address from the kmemleak file and jump to this address in IDA Pro.
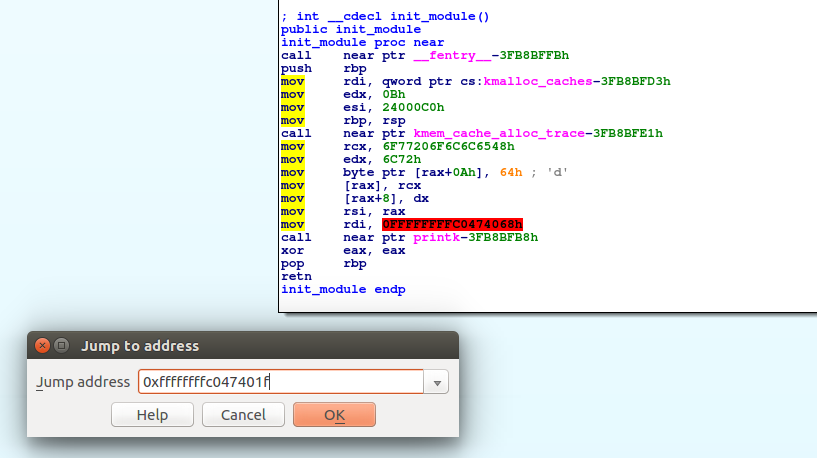
Now we have the position for disassembly where the memory leak is produced but I would rather like to have the exact code line. At the bottom of the IDA Pro we now have information about the position.

This information tells us the function name and its offset inside it. As this is a very small kernel module the function name would be totaly enough to find the leak but if the functions inside the kernel module would be rather large I would still prefer the line number.
Now that I have the offset inside the function where the leak is I wanted to find out the function address. To do this i used GDB, opened my kernel module and entered the line: info address init_module.
What I got was the init_module function address. Added this address together with the offset we get the exact position of the leak. Again with GDB it is now possible to get the exact line number.

If we now go back to the source code we find a strncpy on line number 12 and not a memory allocation. The memory allocation is just one line above. The reason for this is that the kmemleak file prints a stack backtrace. A stack backtrace consists of return instruction pointers and therefore they point after the given function call. For my case the accuracy of plus minus one line was enough and so I got rid of all the remaining memory leaks inside the kernel module which lead to a quite stable malware recorder.